Publishing reproducible documents with Quarto

INFO 5940
Cornell University

Presentations using Quarto

Quarto presentation formats

  • revealjs - open-source HTML presentation format
  • beamer for LaTex slides
  • Powerpoint for when you have to collaborate via Office

revealjs

reveal.js is an open source HTML presentation framework. It’s a tool that enables anyone with a web browser to create fully-featured and beautiful presentations for free.

Core workflow

---
format: revealjs
---

## Step 1
- Split slides up with level 2 headers: `## Heading 2`
- Add some markdown + text and/or some R/Python code

## Step 2
- quarto render

## Step 3
- Profit

Your Turn

  • Download usethis::use_course("cis-ds/reproducible-docs")
  • Open revealjs-penguins.qmd
  • Explore the code
  • Add a new slide with a level 2 header and some text
  • Render it!

YAML for these slides

---
format: 
  revealjs:
    slide-number: c/t
    width: 1600
    height: 900
    css: ["theme/theme.css"]
    theme: simple
    echo: true
---

Transitions

Transition Description
none No transition (switch instantly)
fade Cross fade
slide Slide horizontally
convex Slide at a convex angle
concave Slide at a concave angle
zoom Scale the incoming slide so it grows in from the center of the screen.
---
title: "Presentation"
format:
  revealjs:
    transition: slide
    transition-speed: fast
---

Sizing

width The “normal” width of the presentation, aspect ratio will be preserved when the presentation is scaled to fit different resolutions. Can be specified using percentage units.
height The “normal” height of the presentation, aspect ratio will be preserved when the presentation is scaled to fit different resolutions. Can be specified using percentage units.
format:
  revealjs:
    height: 900
    width: 1600

Slide numbering

slide-number

Display the page number of the current slide

  • true: Show slide number

  • false: Hide slide number

Can optionally be set as a string that specifies the number formatting:

  • h.v: Horizontal . vertical slide number

  • h/v: Horizontal / vertical slide number

  • c: Flattened slide number

  • c/t: Flattened slide number / total slides (default)

---
format:
  revealjs:
    slide-number: c/t #< collapsed/total
---

Presentation preview

  • In the latest version of RStudio, Quarto revealjs presentations will open up as a “background job” in the Presentation tab.

Your Turn

  • Using RStudio, create a new revealjs Quarto presentation
  • Change YAML:
    • author for your name
    • titled “My first Quarto Presentation!”
    • Add slide numbering (what do the different types mean?)
  • Write out what you did this morning (woke up, ate breakfast, walked to this room, etc) in sub-sections
  • New sections should have level 2 headers
  • Add a code chunk
  • Link out to an image with markdown syntax
  • Render it!

Separate slides

  • Level 2 header = new slide

  • Level 1 header = new slide and new section

  • --- can also delineate slides via horizontal rules or leave the heading “blank” for untitled slides

Reminder about pandoc div and spans

::: {.class}
<SOME CONTENT>
:::
Some text with a specific [span]{.span-class}

Lists

  • Create lists with - or * or 1.

Incrementally reveal elements with:

::: {.incremental}

- First item
- Second item

:::

Or affect globally:

format:
  revealjs:
    incremental: true

Or turn it off for specific lists

::: {.nonincremental}

- 1st Item
- 2nd Item

:::

Incremental lists

  • First item
  • Second item
  • Last item

Incremental reveal

Not limited to just bullet points…

Use . . . syntax to indicate a break at an arbitrary location

head(penguins)
# A tibble: 6 × 8
  species island    bill_length_mm bill_depth_mm flipper_l…¹ body_…² sex    year
  <fct>   <fct>              <dbl>         <dbl>       <int>   <int> <fct> <int>
1 Adelie  Torgersen           39.1          18.7         181    3750 male   2007
2 Adelie  Torgersen           39.5          17.4         186    3800 fema…  2007
3 Adelie  Torgersen           40.3          18           195    3250 fema…  2007
4 Adelie  Torgersen           NA            NA            NA      NA <NA>   2007
5 Adelie  Torgersen           36.7          19.3         193    3450 fema…  2007
6 Adelie  Torgersen           39.3          20.6         190    3650 male   2007
# … with abbreviated variable names ¹​flipper_length_mm, ²​body_mass_g

Incremental reveal

Not limited to just bullet points...

Use `. . .` syntax to indicate a break at an arbitrary location

. . .

```{r}
head(penguins)
```

Column layout

:::: {.columns}

::: {.column width="40%"}
contents...
:::

::: {.column width="60%"}
contents...
:::

::::

Column layout

On the left

On the right

Column layout

```{r}
#| eval: false
dplyr::glimpse(penguins)
```
Rows: 344
Columns: 8
$ species           <fct> Adelie, Adelie, Adelie, Adelie, Adelie, Adelie, Adel…
$ island            <fct> Torgersen, Torgersen, Torgersen, Torgersen, Torgerse…
$ bill_length_mm    <dbl> 39.1, 39.5, 40.3, NA, 36.7, 39.3, 38.9, 39.2, 34.1, …
$ bill_depth_mm     <dbl> 18.7, 17.4, 18.0, NA, 19.3, 20.6, 17.8, 19.6, 18.1, …
$ flipper_length_mm <int> 181, 186, 195, NA, 193, 190, 181, 195, 193, 190, 186…
$ body_mass_g       <int> 3750, 3800, 3250, NA, 3450, 3650, 3625, 4675, 3475, …
$ sex               <fct> male, female, female, NA, female, male, female, male…
$ year              <int> 2007, 2007, 2007, 2007, 2007, 2007, 2007, 2007, 2007…

Output location, column-fragment

```{r}
#| output-location: column-fragment
#| code-line-numbers: "|2"

library(ggplot2)

penguins %>% 
  ggplot(aes(x = body_mass_g, y = flipper_length_mm)) +
  geom_point() +
  geom_smooth(method = "loess", formula = "y~x")
```

Output location, column

```{r}
#| output-location: column
#| code-line-numbers: "|2"

library(ggplot2)

penguins %>% 
  ggplot(aes(x = body_mass_g, y = flipper_length_mm)) +
  geom_point() +
  geom_smooth(method = "loess", formula = "y~x")
```

Output location, fragment
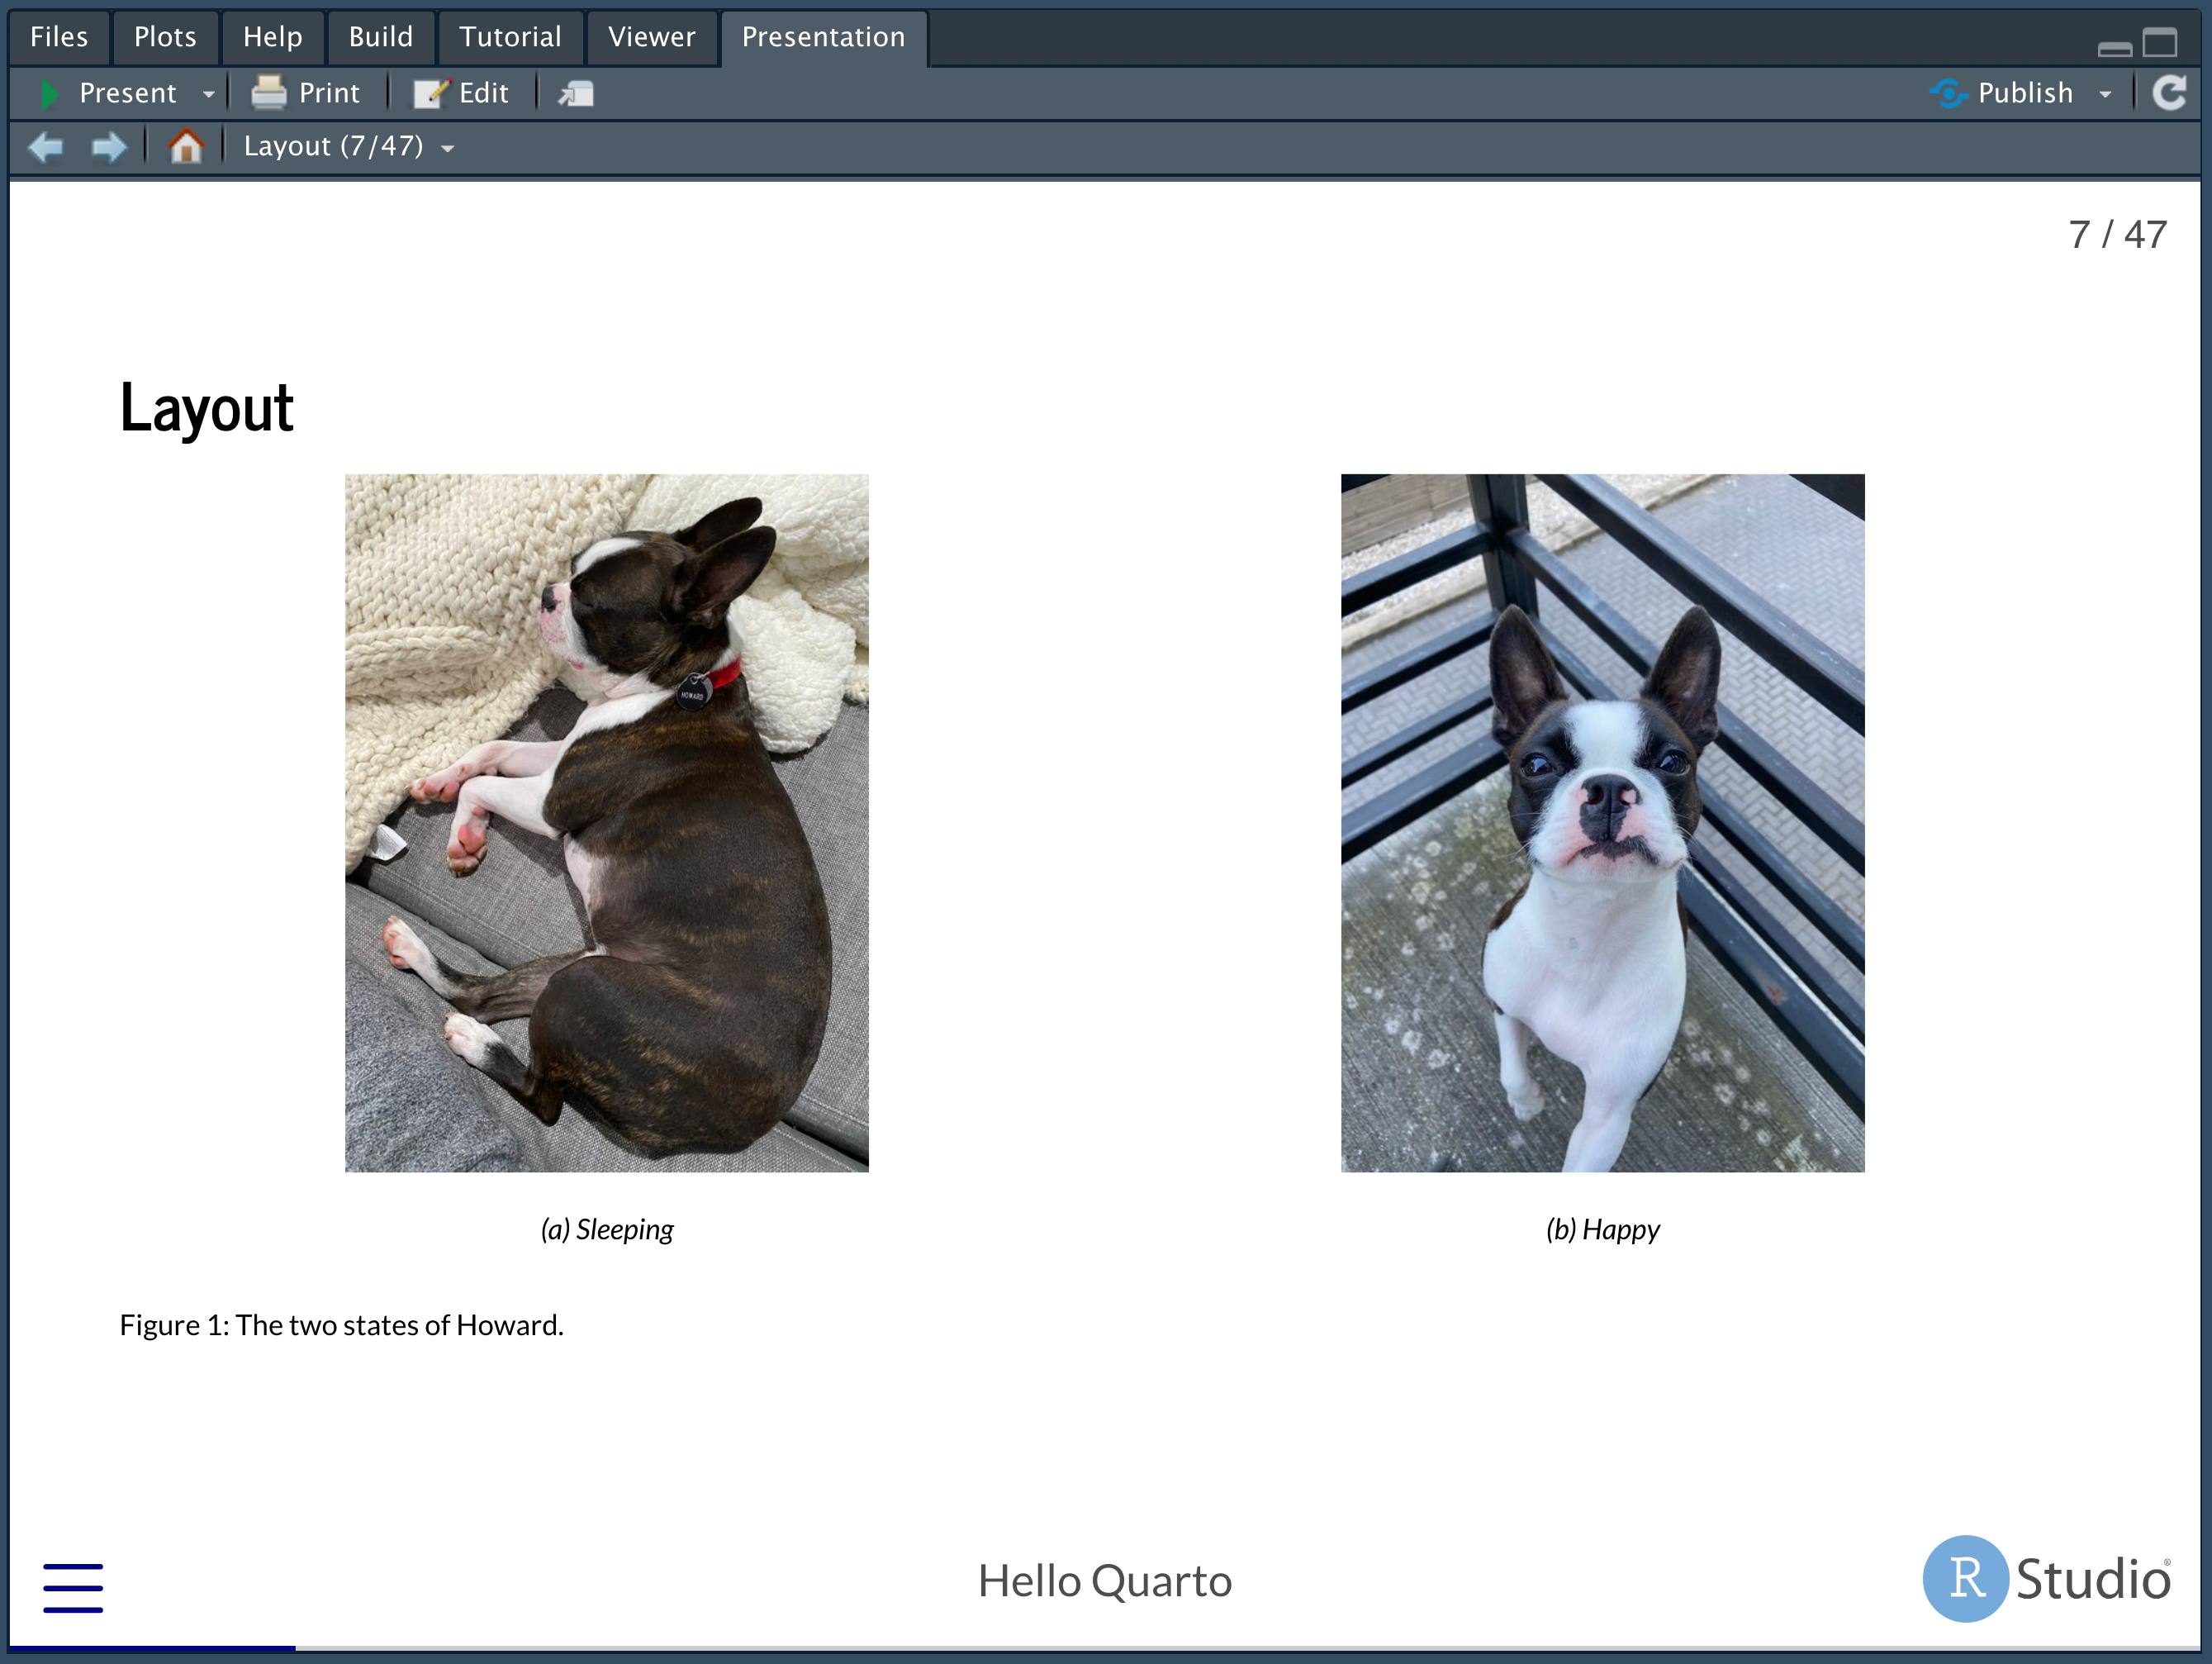
```{r}
#| output-location: fragment
#| code-line-numbers: "|2"

library(ggplot2)

penguins %>% 
  ggplot(aes(x = body_mass_g, y = flipper_length_mm)) +
  geom_point() +
  geom_smooth(method = "loess", formula = "y~x")
```

Images

![](images/boston-sleep.png){fig-align="center"}

![](images/boston-sleep.png)

Images

::: columns
::: {.column width="50%"}
    ![](images/boston-sleep.png){fig-align="center"}

![](images/boston-sleep.png){fig-align="center"}
:::

::: {.column width="50%"}
    ![](images/boston-sleep.png)

![](images/boston-sleep.png)
:::
:::

Stack layout

Incremental reveal of images/content

Title Slide, YAML edition

---
format: revealjs
title: Hello Quarto
subtitle: Slides with revealjs
author: <a href="https://bensoltoff.com">Benjamin Soltoff</a>
date: 2022-10-04
institute: Cornell University
---

Tabsets

::: {.panel-tabset}

## Element 1

## Element 2

:::

Tabsets

```{r}
#| eval: false
head(penguins)
```
# A tibble: 6 × 8
  species island    bill_length_mm bill_depth_mm flipper_l…¹ body_…² sex    year
  <fct>   <fct>              <dbl>         <dbl>       <int>   <int> <fct> <int>
1 Adelie  Torgersen           39.1          18.7         181    3750 male   2007
2 Adelie  Torgersen           39.5          17.4         186    3800 fema…  2007
3 Adelie  Torgersen           40.3          18           195    3250 fema…  2007
4 Adelie  Torgersen           NA            NA            NA      NA <NA>   2007
5 Adelie  Torgersen           36.7          19.3         193    3450 fema…  2007
6 Adelie  Torgersen           39.3          20.6         190    3650 male   2007
# … with abbreviated variable names ¹​flipper_length_mm, ²​body_mass_g

Code

Code line-highlighting

Use #| code-line-numbers: "3" syntax - will highlight line and fade other lines

```{r}
#| output-location: column
#| code-line-numbers: "3"

library(ggplot2)

penguins %>% 
  ggplot(aes(x = body_mass_g, y = flipper_length_mm)) +
  geom_point() +
  geom_smooth(method = "loess", formula = "y~x")
```

Code line-highlighting

Sometimes you want to make a point though…

```{r}
#| output-location: column
#| code-line-numbers: "|3"

library(ggplot2)

penguins %>% 
  ggplot(aes(x = body_mass_g, y = flipper_length_mm)) +
  geom_point() +
  geom_smooth(method = "loess", formula = "y~x")
```

Code line-highlighting

And I often want to “walk through” a set of code!

```{r}
#| output-location: column
#| code-line-numbers: "|3|5|8|10"

library(ggplot2)

penguins %>% 
  ggplot(aes(x = body_mass_g, y = flipper_length_mm)) +
  geom_point() +
  geom_smooth(method = "loess", formula = "y~x")
```

Themes/Appearance

https://quarto.org/docs/presentations/revealjs/themes.html

---
title: "Presentation"
format:
  revealjs: 
    theme: serif
---
---
title: "Presentation"
format:
  revealjs: 
    theme: dark
---
---
title: "Presentation"
format:
  revealjs: 
    theme: [default, custom.scss]
---

Websites using Quarto

Websites

  • Websites are essentially format: html + a Quarto Project
  • Website is different than format: html in that it has multiple pages
  • Website is our first exploration into Quarto Projects
    • Similar to R Projects, but for Quarto!

Why not WordPress, Tumblr, Medium.com, Blogger.com, etc?1

  • No Quarto support (even math support is often nonexistent or awkward)

  • Huge benefits of static websites compared to dynamic websites

  • all static files, no PHP or databases, no login/password, work everywhere (even offline)

  • typically fast to visit (no computation needed on the server side), and easy to speed up via CDN

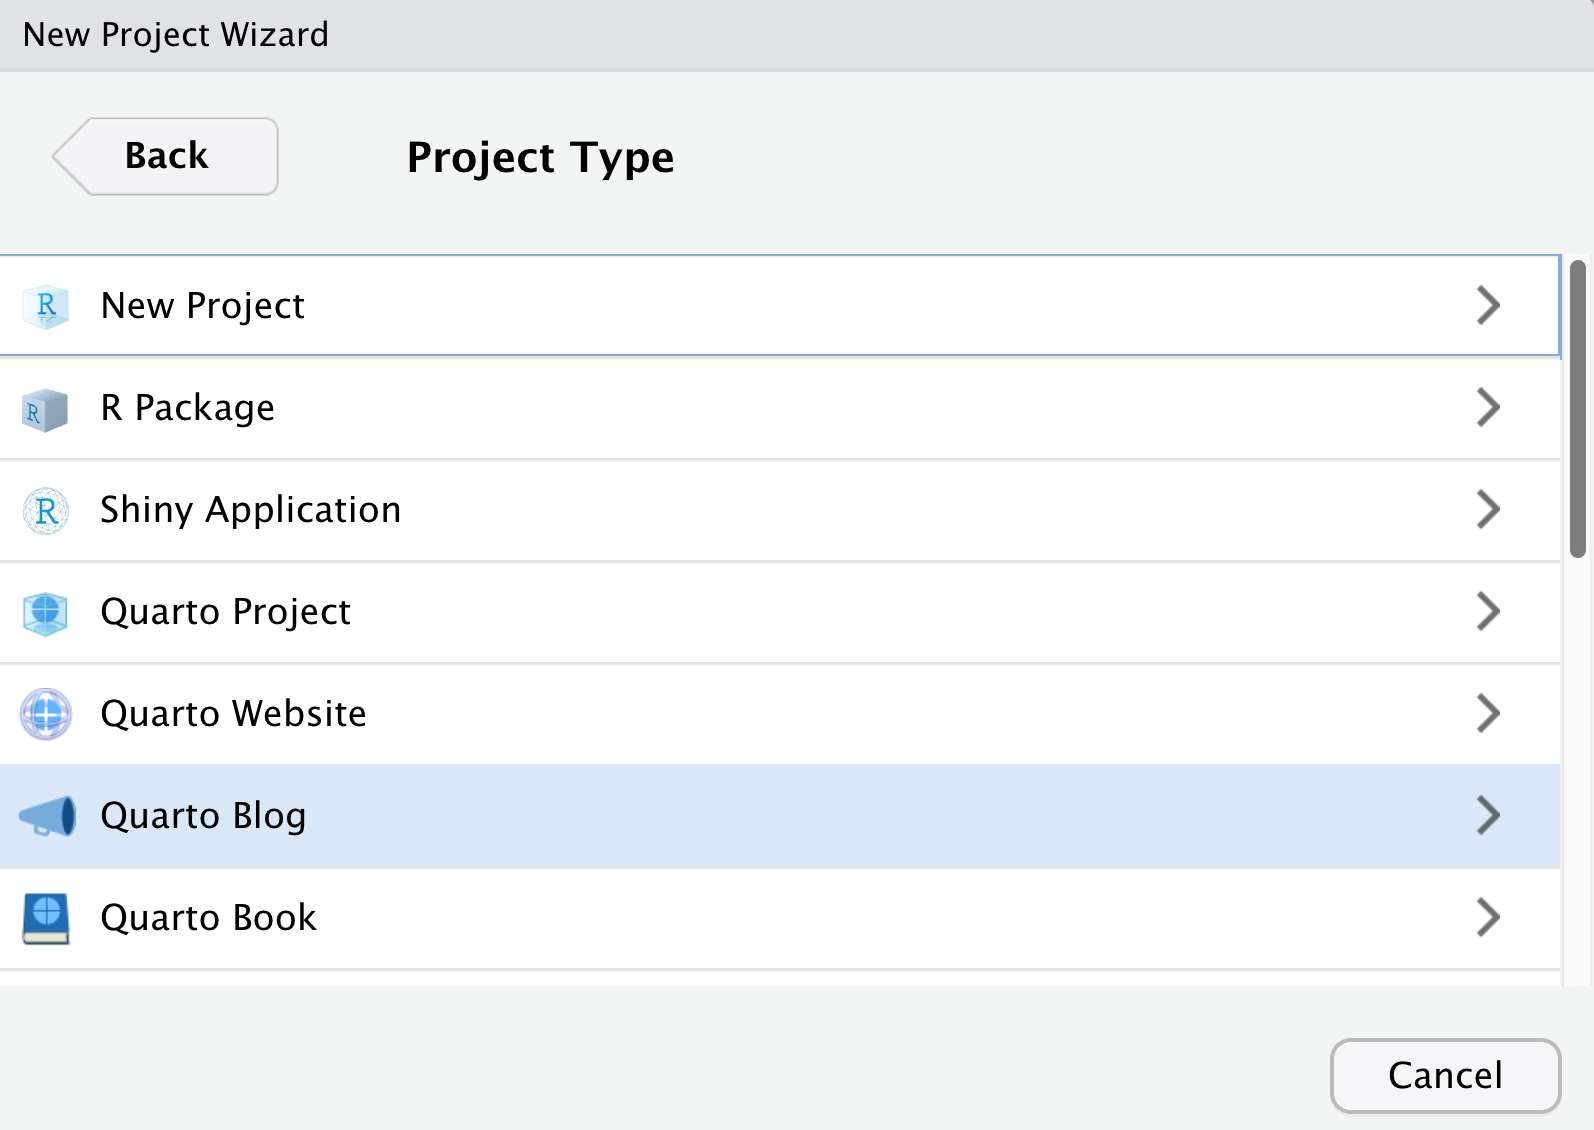
RStudio > New Project > New Quarto Blog

Create a blog

  • A blog is a website with specific “opinions” already made
  • Includes a listing automatically from posts directory
  • Can build custom listings in several ways

Core blog workflow

  • Create a new folder under /posts - this folder will be the “slug” URL (like bensoltoff.com/2022-07-25-new-post/)
  • Create a new index.qmd within the new folder

Your Turn

  • Create a new RStudio project (in a separate RStudio session) and select Quarto blog
  • Give it a name
  • Explore the directory

Rendering posts

  • On a specific post, Render with RStudio > Render
  • Build tab > Render/Preview Website

These will preview the entire website

When you render the website, it will re-execute code in older posts. Not ideal in many situations!

Your Turn

  • Let’s render the index.qmd together!
  • Now, let’s try Build > Render Website

Freeze

You can use the freeze option to denote that computational documents should never be re-rendered during a global project render, or alternatively only be re-rendered when their source file changes

execute:
  freeze: true  # never re-render during project render
execute:
  freeze: auto  # re-render only when source changes

freeze: true is typically added to a _metadata.yml file within a specific directory, affecting all files in that directory.

In the case of a blog - the _metadata.yml is saved at the root of the posts directory. You can have it only within specific subdirectories for more complex sites.

Cache

Cache on the other hand, stores the results of computations for a specific file.

Note that cache invalidation is triggered by changes in chunk source code (or other cache attributes you’ve defined).

execute:
  cache: true

I typically use cache throughout various types of outputs when I have computationally expensive chunks.

Your Turn

  • Render index.qmd in the project directory and note the items that are built

  • Explore the _freeze directory

  • Marvel at the “beautiful” JSON - it’s not for you, it’s for the machine

Themes

https://quarto.org/docs/websites/website-blog.html#themes

default, cerulean, cosmo, cyborg, darkly, flatly, journal, litera, lumen, lux, materia, minty, morph, pulse, quartz, sandstone, simplex, sketchy, slate, solar, spacelab, superhero, united, vapor, yeti, zephyr

To change theme, modify the bottom of your website’s _quarto.yml

format:
  html:
    theme: cosmo

Themes

Your Turn

  • Open _quarto.yml and change the theme to one of the support Bootswatch themes
  • Create a new folder in /posts/ - title it 2022-12-05-my-first-post
  • Create a new blank index.qmd in that folder, add a format: html YAML header
  • Add some text and a markdown image: ![](), along with maybe some code
  • Render it!

Adding an About page

twitter-card:
  image: images/profile-preview.png
  creator: "@soltoffbc"
open-graph: true
title: "Benjamin Soltoff"
image: images/profile-preview.png
about:
  template: trestles
  links:
    - icon: twitter
      text: Twitter
      href: https://twitter.com/soltoffbc
    - icon: github
      text: Github
      href: https://github.com/bensoltoff

About page templates
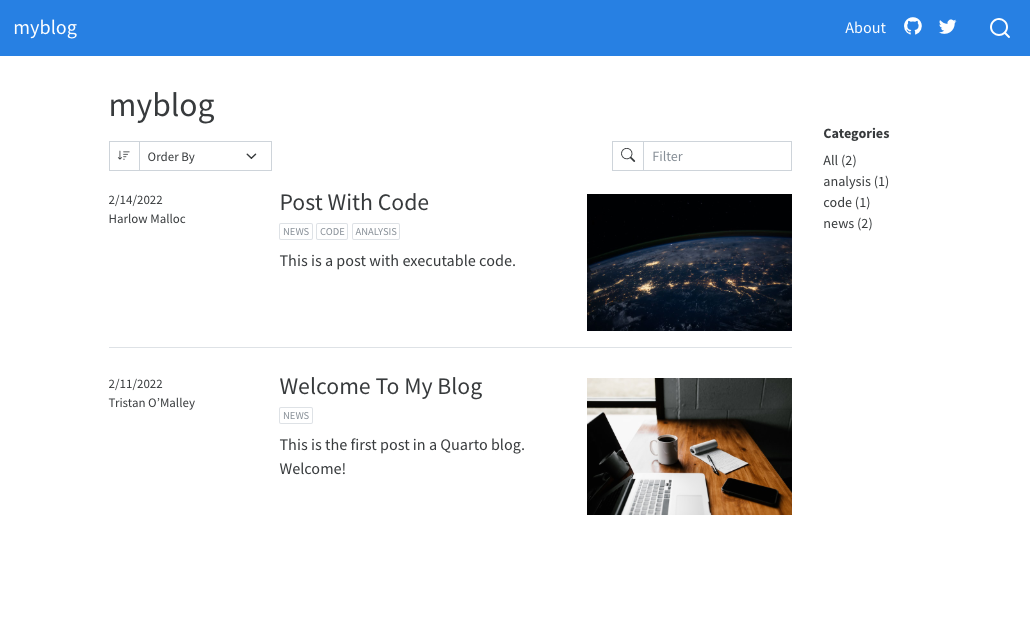
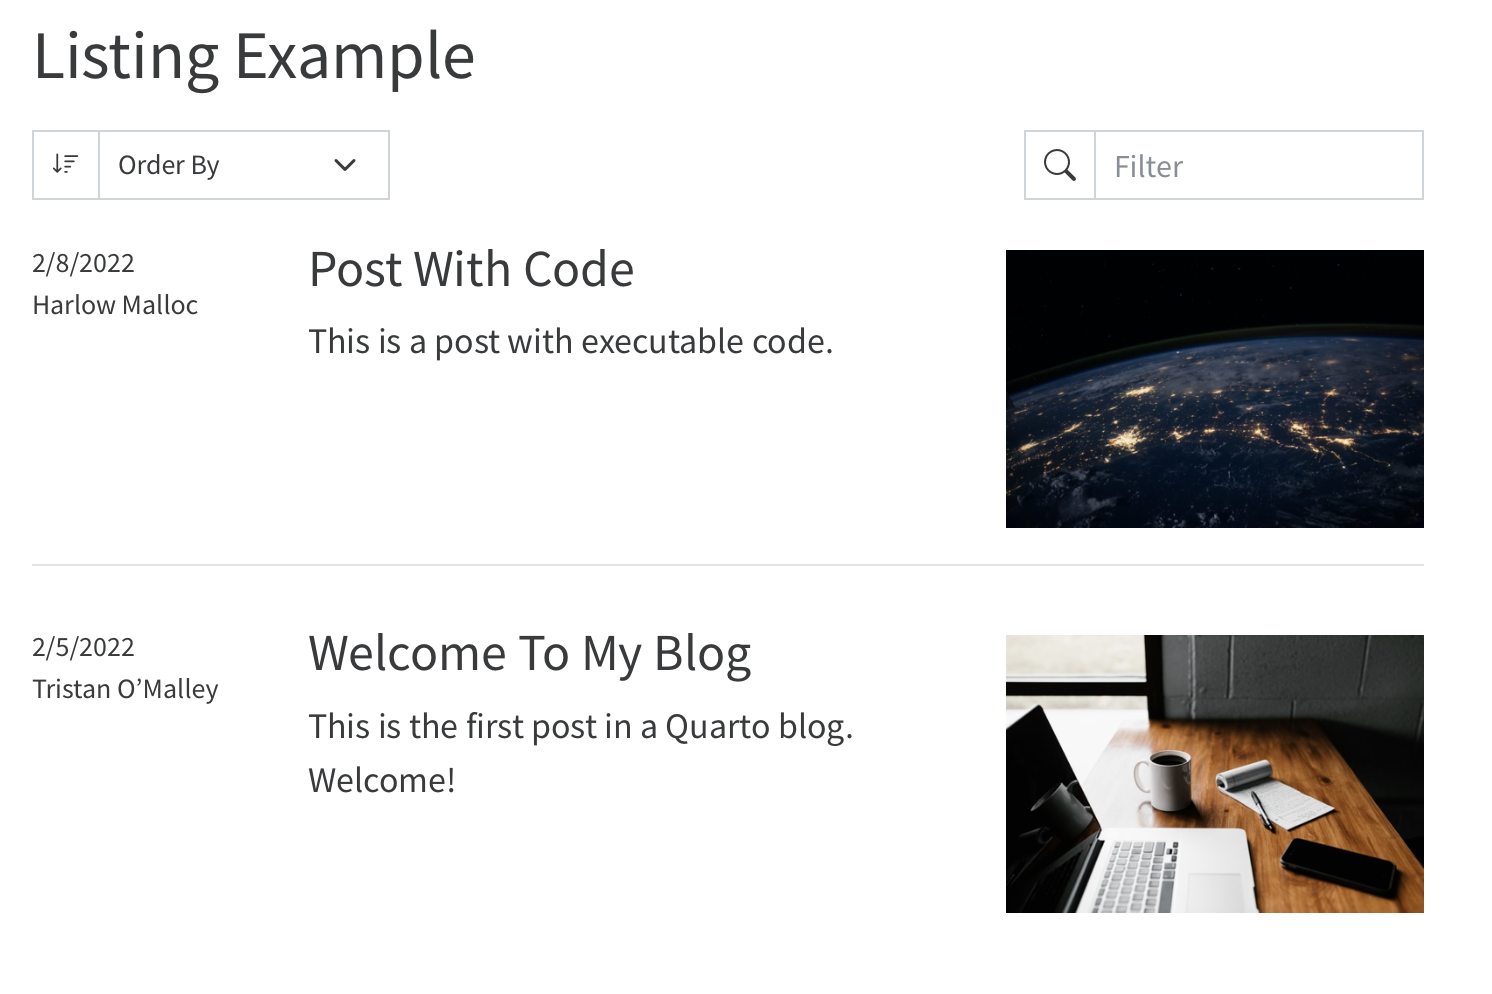
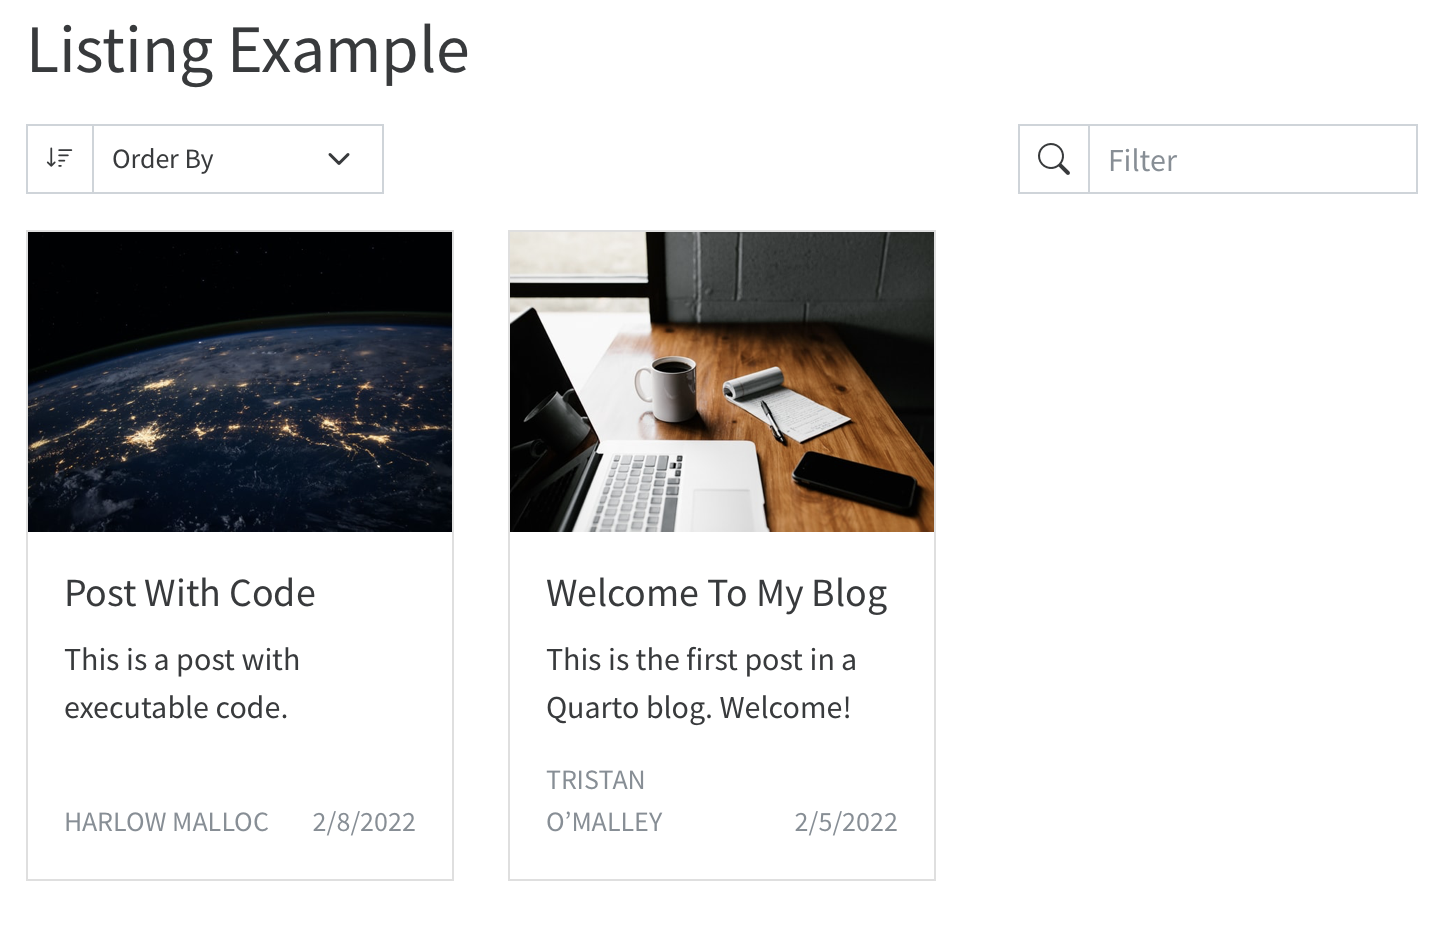
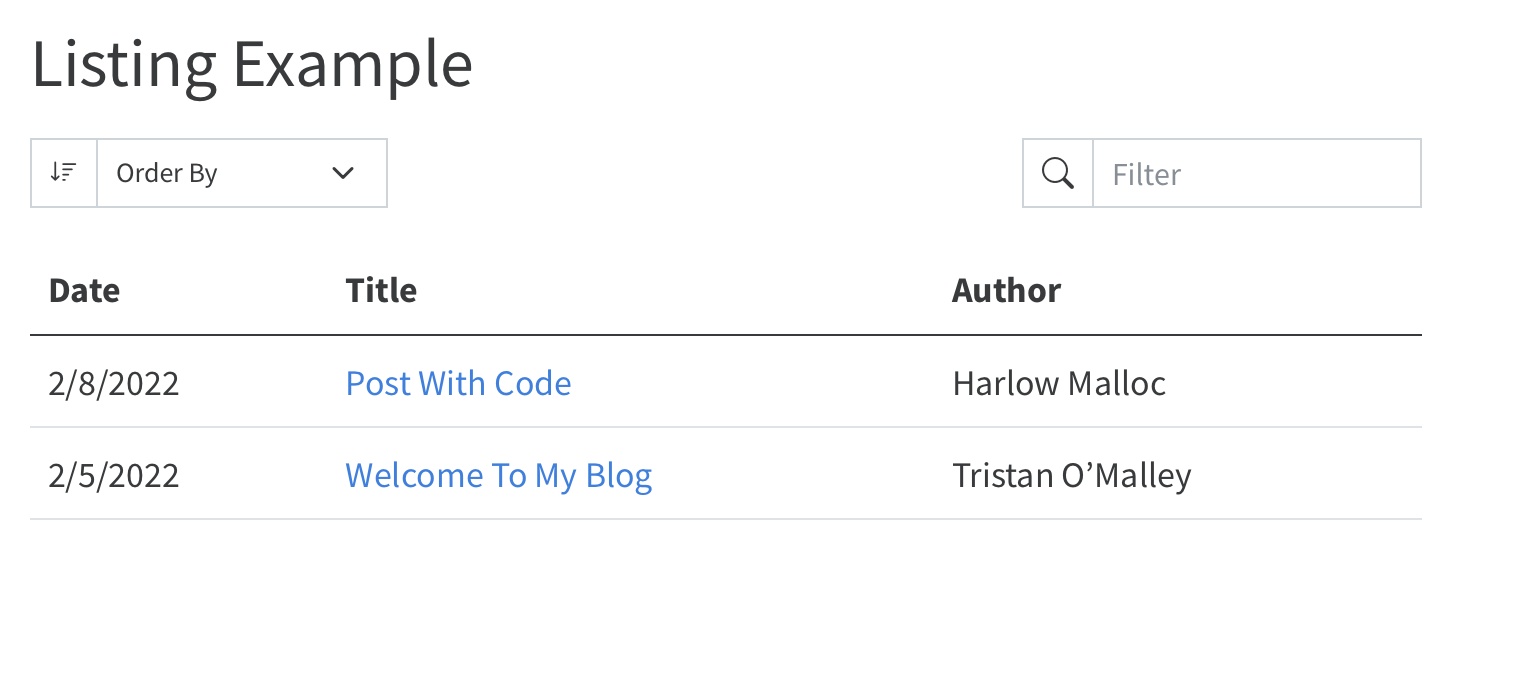
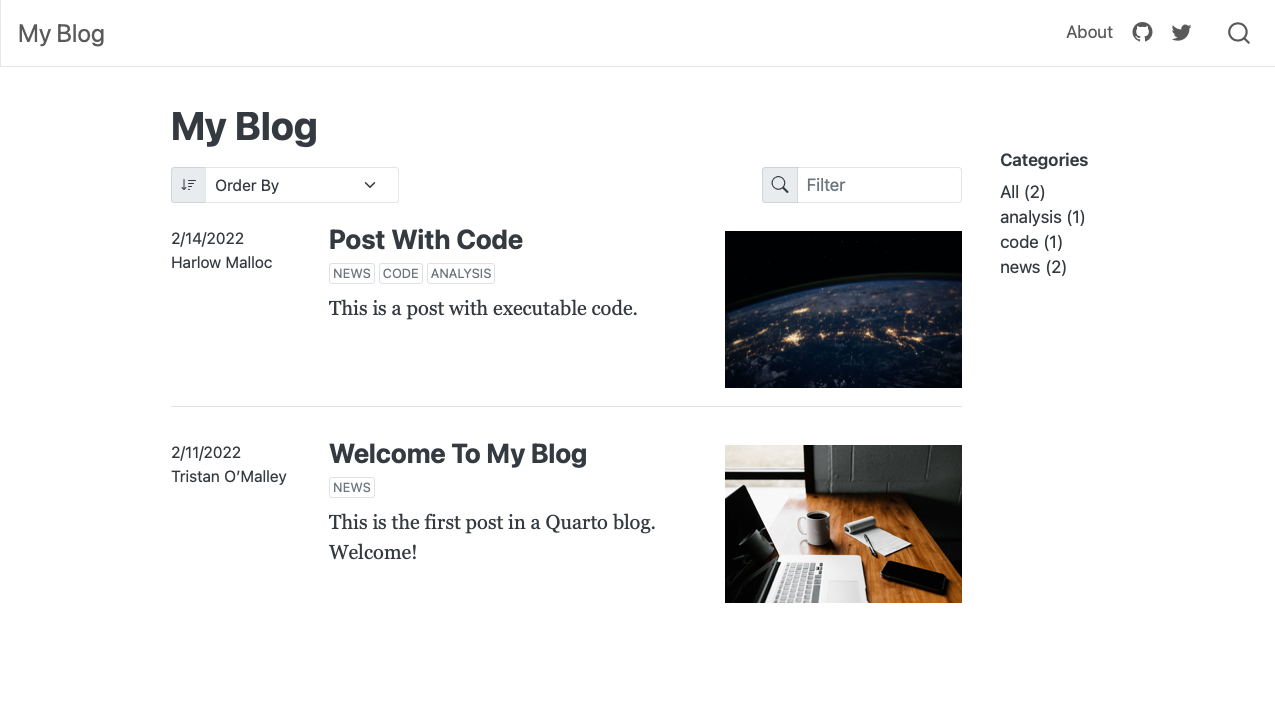
about:
  template: trestles

Your Turn

  • Open your about page (about.qmd)
  • Change some of the details, add more details and choose a specific template (jolla, trestles, solana, marquee, broadside)
  • Render it!

Landing page

  • The landing page for your website defaults to the blog/listings page
  • your-proj/index.qmd becomes your “home page”
  • If you want your “About Me” page to be the landing page, rename your index.qmd -> blog.qmd and about.qmd -> index.qmd
  • Re-structuring your website also requires modifying your _quarto.yml
website:
  title: "My blog name"
  site-url: "https://MyBlogSiteUrl.com"
  navbar:
    right:
     - blog.qmd
     - icon: twitter
       href: "https://twitter.com/my_user_name"

Example: https://www.ericekholm.com/posts/demo-quarto-site/

Listings

Listings

Type Description
default A blog style list of items.
table A table of listings.
grid A grid of listing cards.

Listings

By default, listings will appear in full width rows that display the item’s metadata (author and date), title, description, and image.

Grid style listings display a card for each item.

The table listing style provides a traditional tabular layout.

Your Turn

  • Open your existing Quarto blog from before
  • Let’s change the listing type of our blog - change from default to grid
  • Re-render the index.qmd

Publishing

Destination Description
GitHub Pages Publish content based on source code managed within a GitHub repository. Use GitHub Pages when the source code for your document or site is hosted on GitHub.
RStudio Connect Publishing platform for secure sharing of data products within an organization. Use RStudio Connect when you want to publish content within an organization rather than on the public internet.
Netlify Professional web publishing platform. Use Netlify when you want support for custom domains, authentication, previewing branches, and other more advanced capabilities.
Other Services Content rendered with Quarto uses standard formats (HTML, PDFs, MS Word, etc.) that can be published anywhere. Use this if one of the methods above don’t meet your requirements.

Publishing

Static Only

  • quarto R package: quarto::quarto_publish_???()

Code

  • Evaluate R/Python code and render on a schedule

  • RStudio Connect

  • rsconnect::deployDoc(quarto = "path/to/quarto")

    • rsconnect::deployDoc(quarto = quarto::quarto_path())

Static Publish

  • quarto::quarto_publish_???()

    • quarto_publish_site(server = "rstudioconnect.example.com")
    • quarto_publish_doc(server = "rpubs.com")
    • quarto_publish_app(server = "shinyapps.io")

Netlify

  • Cheat code: Netlify drop

GitHub Pages

  • Name your content index.qmd to generate index.html -> Push to GitHub

Websites

Similar to blog, but less of a focus on listing/posts and more focus on individual pages and overall navigation.

Quarto Project

When you create a project, a _quarto.yml config file is created. Here is an example of what the _quarto.yml looks like:

project:
  output-dir: _output

toc: true
number-sections: true
bibliography: references.bib  
  
format: #< default format inherited by other documents
  html:
    css: styles.css

Quarto Projects

  • Minimal project has at least 1x file and 1x _quarto.yml
  • A project is a directory (and can have sub-directories)

A typical project is used to:

  • Aggregate content (website/blog/book)
  • Share metadata (YAML config) across multiple files
  • Render an entire directory together or redirect output to another directory
  • Freeze computation across a project or team