Practice drawing raster maps
library(tidyverse)
library(ggmap)
library(here)

options(digits = 3)
set.seed(123)
theme_set(theme_minimal())
Run the code below in your console to download this exercise as a set of R scripts.
usethis::use_course("cis-ds/visualize-spatial-i")
New York City 311 data
New York City has an excellent data portal publishing a large volume of public records. Here we’ll look at a subset of the 311 service requests. I used RSocrata and the data portal’s API to retrieve a portion of the data set.
If you are copying-and-pasting code from this demonstration, use
nyc_311 <- read_csv("https://info5940.infosci.cornell.edu/data/nyc-311.csv") to download the file from the course website.glimpse(nyc_311)
## Rows: 352,992
## Columns: 6
## $ unique_key     <dbl> 23013481, 23013484, 23013505, 23013528, 23013557, 23013…
## $ created_date   <dttm> 2012-04-05 15:52:10, 2012-04-05 16:47:38, 2012-04-05 1…
## $ complaint_type <chr> "Food Poisoning", "Sidewalk Condition", "Sidewalk Condi…
## $ borough        <chr> "MANHATTAN", "QUEENS", "BROOKLYN", "MANHATTAN", "BROOKL…
## $ latitude       <dbl> 40.8, 40.7, 40.6, 40.7, 40.6, 40.6, 40.6, 40.8, 40.5, 4…
## $ longitude      <dbl> -74.0, -73.9, -74.0, -74.0, -74.0, -74.1, -74.1, -73.9,…
Exercise: Visualize the 311 data
Obtain map tiles using
ggmapfor New York City.Click for the solution
# store bounding box coordinates
nyc_bb <- c(
  left = -74.263045,
  bottom = 40.487652,
  right = -73.675963,
  top = 40.934743
)

nyc <- get_stamenmap(
  bbox = nyc_bb,
  zoom = 11
)

# plot the raster map
ggmap(nyc)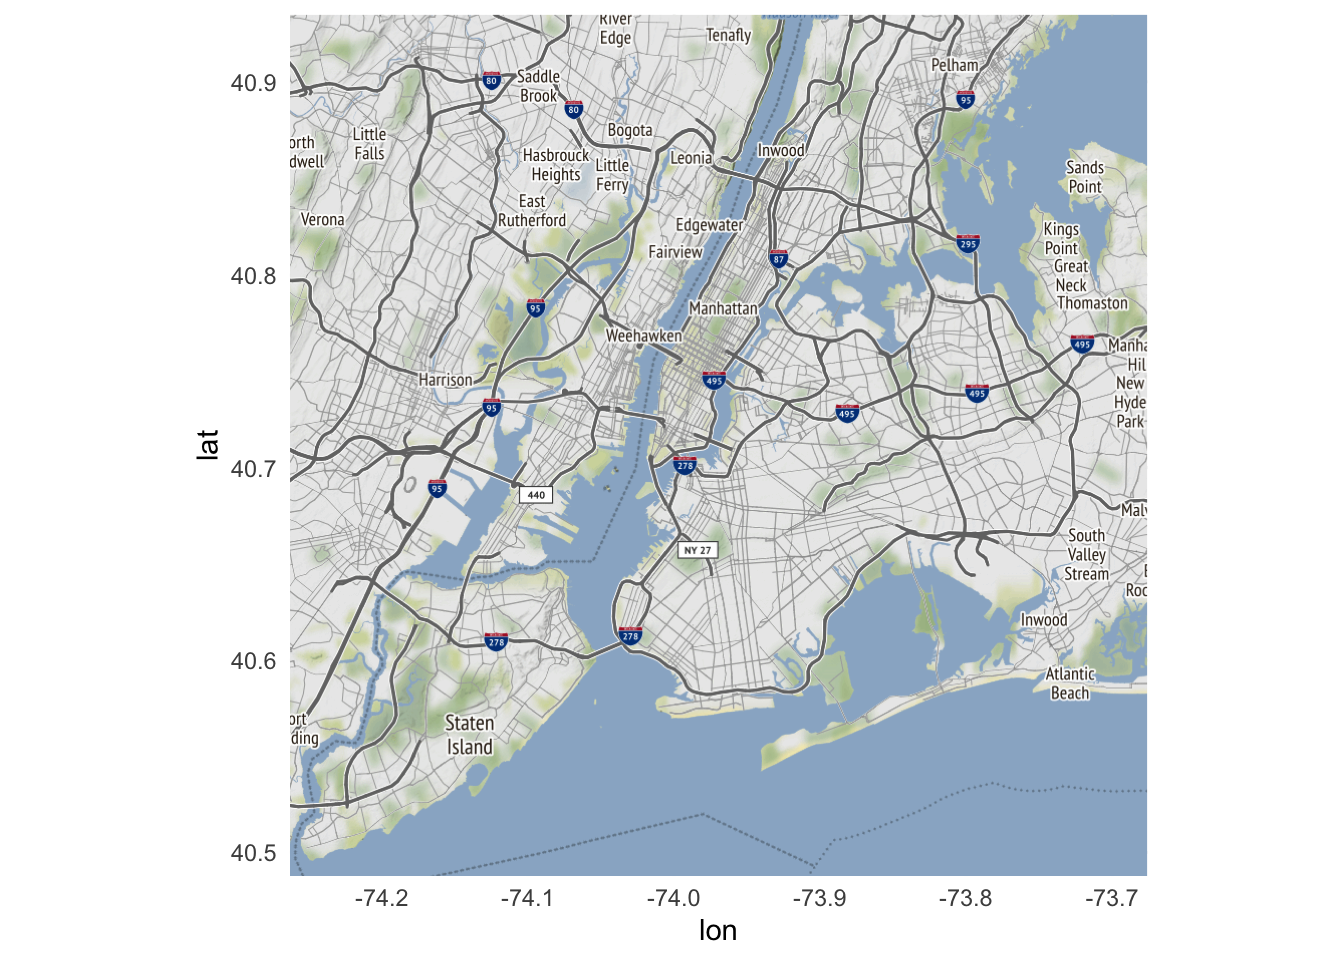
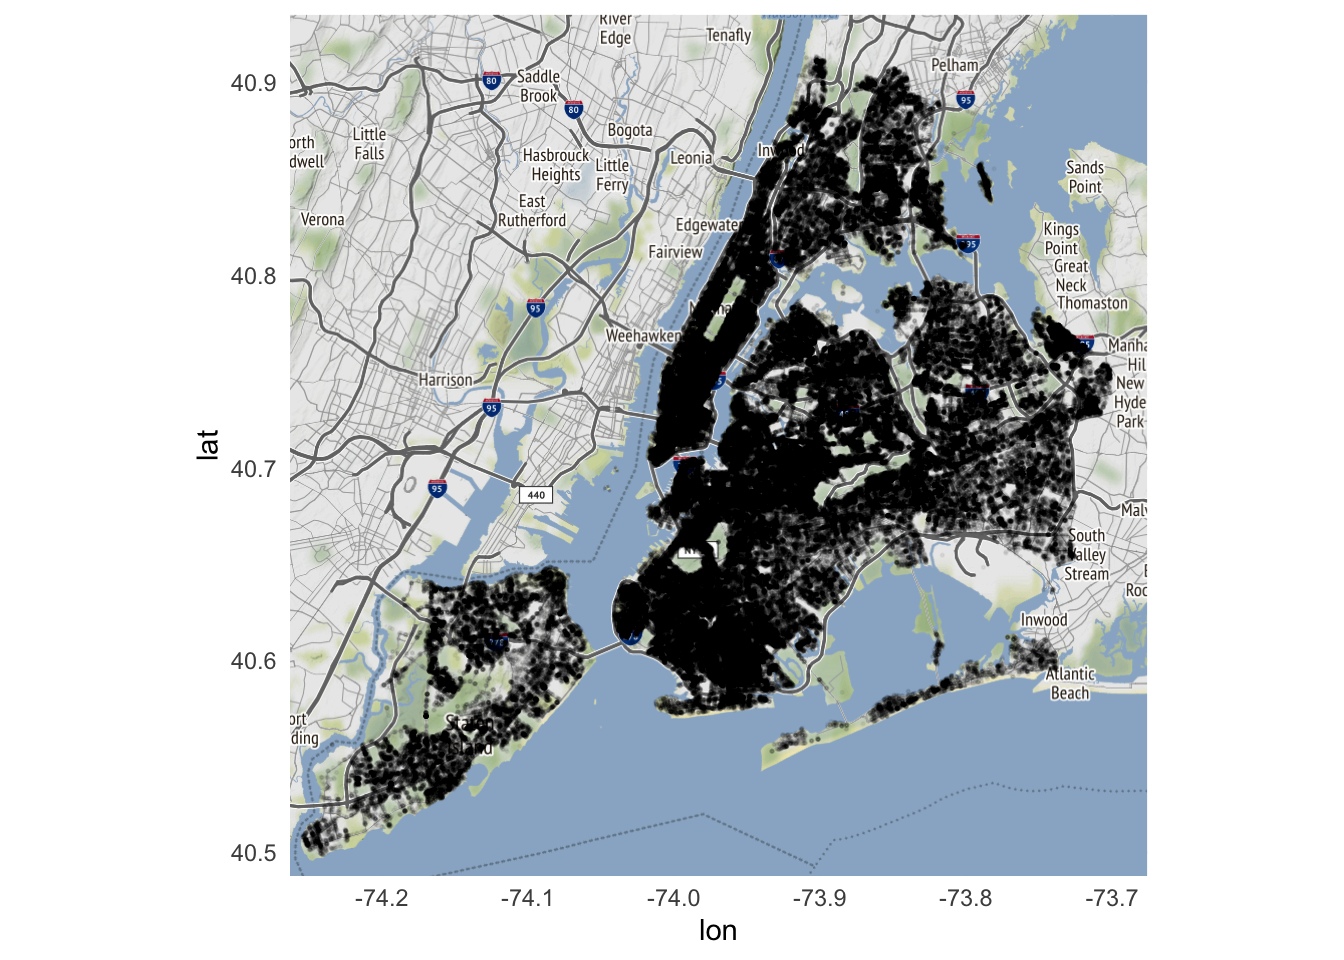
Generate a scatterplot of complaints about sidewalk conditions.
Click for the solution
# initialize map
ggmap(nyc) +
  # add layer with scatterplot
  # use alpha to show density of points
  geom_point(
    data = filter(nyc_311, complaint_type == "Sidewalk Condition"),
    mapping = aes(
      x = longitude,
      y = latitude
    ),
    size = .25,
    alpha = .05
  )
Generate a heatmap of complaints about sidewalk conditions. Do you see any unusual patterns or clusterings?
Click for the solution
# initialize the map
ggmap(nyc) +
  # add the heatmap
  stat_density_2d(
    data = filter(nyc_311, complaint_type == "Sidewalk Condition"),
    mapping = aes(
      x = longitude,
      y = latitude,
      fill = stat(level)
    ),
    alpha = .1,
    bins = 50,
    geom = "polygon"
  )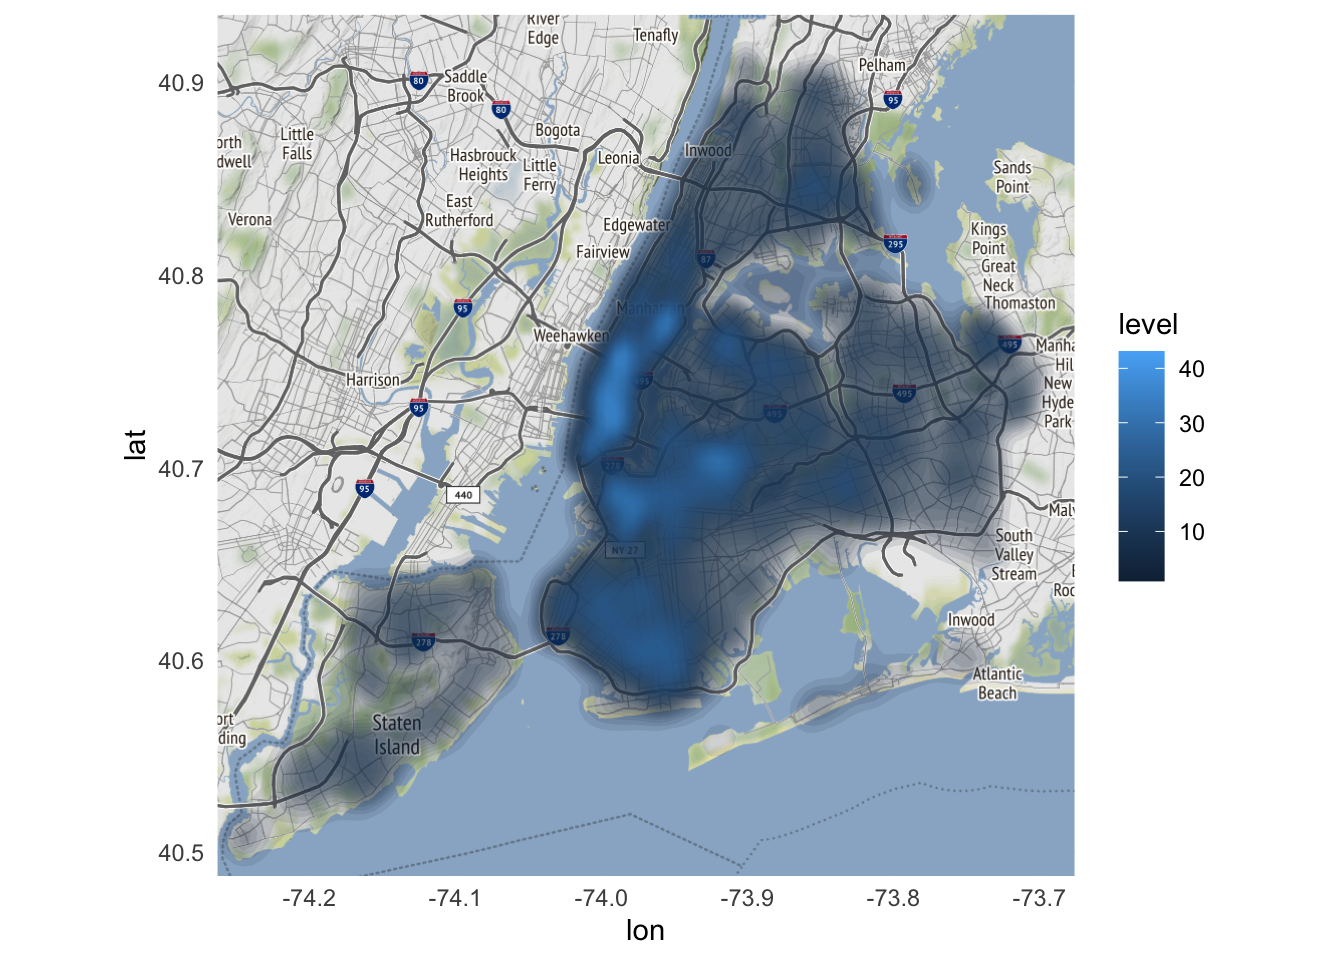
Seems to be clustered most dense in Manhattan and Brooklyn. Makes sense because they receive significant pedestrian traffic.Obtain map tiles for Roosevelt Island.
Click for the solution
roosevelt_bb <- c(
  left = -73.967121,
  bottom = 40.748700,
  right = -73.937080,
  top = 40.774704
)
roosevelt <- get_stamenmap(
  bbox = roosevelt_bb,
  zoom = 14
)

# plot the raster map
ggmap(roosevelt)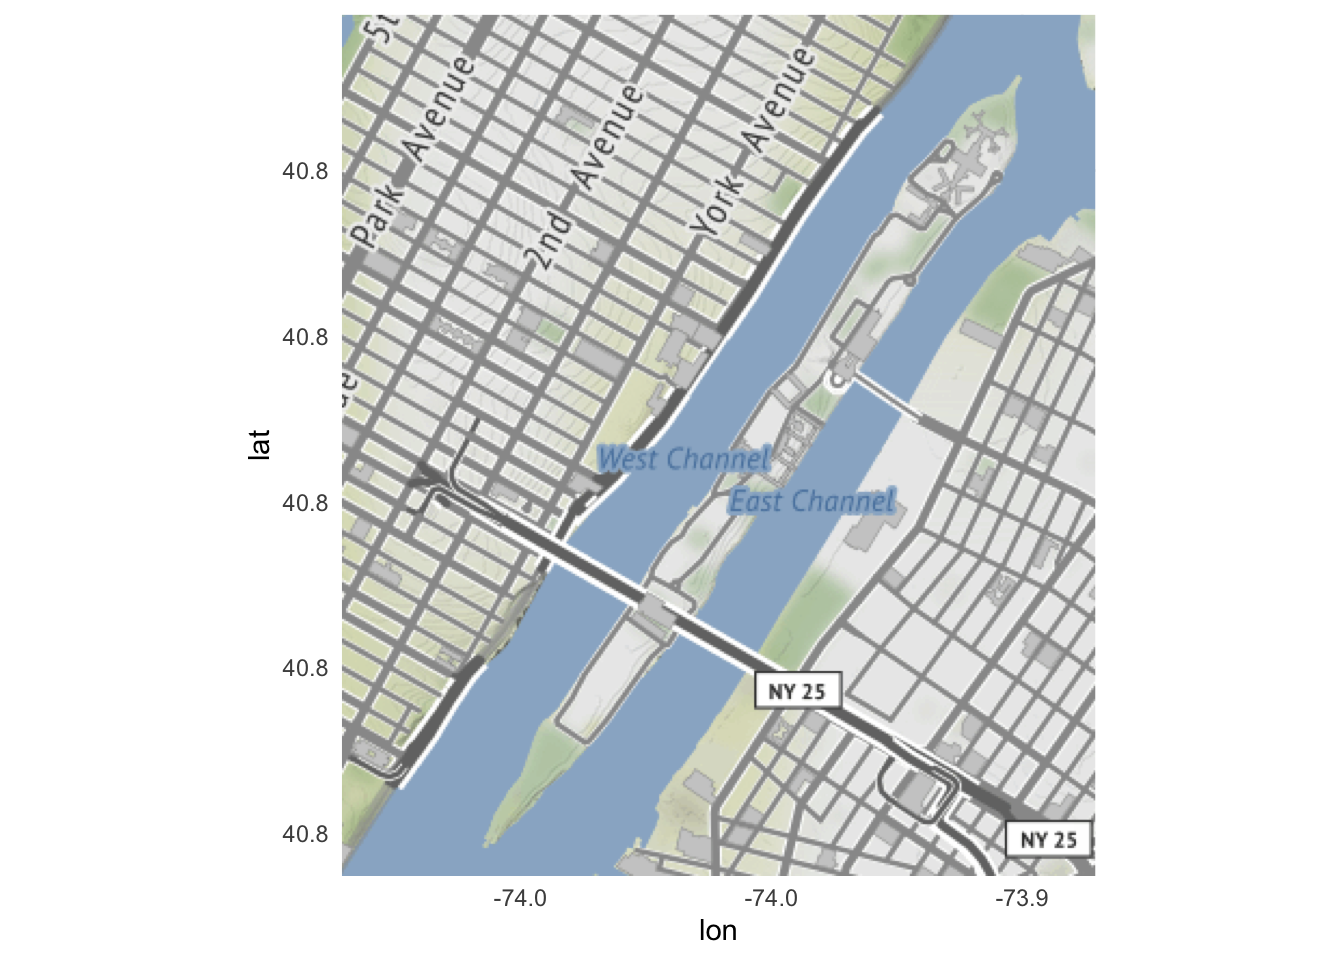
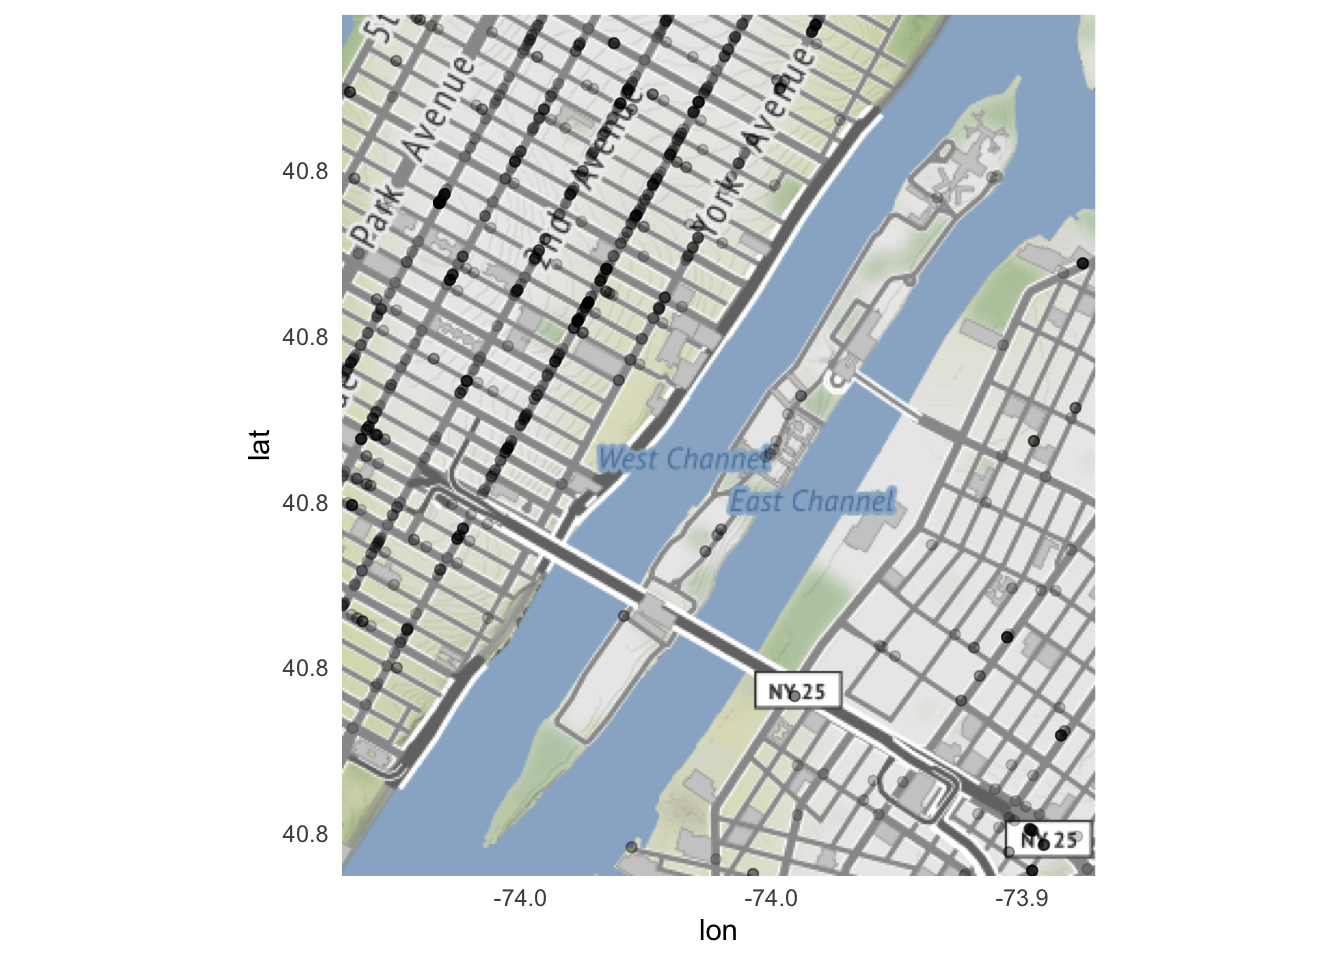
Generate a scatterplot of food poisoning complaints.
Click for the solution
# initialize the map
ggmap(roosevelt) +
  # add a scatterplot layer
  geom_point(
    data = filter(nyc_311, complaint_type == "Food Poisoning"),
    mapping = aes(
      x = longitude,
      y = latitude
    ),
    alpha = 0.2
  )
Session Info
sessioninfo::session_info()
## ─ Session info ───────────────────────────────────────────────────────────────
##  setting  value
##  version  R version 4.2.1 (2022-06-23)
##  os       macOS Monterey 12.3
##  system   aarch64, darwin20
##  ui       X11
##  language (EN)
##  collate  en_US.UTF-8
##  ctype    en_US.UTF-8
##  tz       America/New_York
##  date     2022-10-05
##  pandoc   2.18 @ /Applications/RStudio.app/Contents/MacOS/quarto/bin/tools/ (via rmarkdown)
##
## ─ Packages ───────────────────────────────────────────────────────────────────
##  package       * version    date (UTC) lib source
##  assertthat      0.2.1      2019-03-21 [2] CRAN (R 4.2.0)
##  backports       1.4.1      2021-12-13 [2] CRAN (R 4.2.0)
##  bit             4.0.4      2020-08-04 [2] CRAN (R 4.2.0)
##  bit64           4.0.5      2020-08-30 [2] CRAN (R 4.2.0)
##  bitops          1.0-7      2021-04-24 [2] CRAN (R 4.2.0)
##  blogdown        1.10       2022-05-10 [2] CRAN (R 4.2.0)
##  bookdown        0.27       2022-06-14 [2] CRAN (R 4.2.0)
##  broom           1.0.0      2022-07-01 [2] CRAN (R 4.2.0)
##  bslib           0.4.0      2022-07-16 [2] CRAN (R 4.2.0)
##  cachem          1.0.6      2021-08-19 [2] CRAN (R 4.2.0)
##  cellranger      1.1.0      2016-07-27 [2] CRAN (R 4.2.0)
##  cli             3.4.0      2022-09-08 [1] CRAN (R 4.2.0)
##  codetools       0.2-18     2020-11-04 [2] CRAN (R 4.2.1)
##  colorspace      2.0-3      2022-02-21 [2] CRAN (R 4.2.0)
##  crayon          1.5.1      2022-03-26 [2] CRAN (R 4.2.0)
##  curl            4.3.2      2021-06-23 [2] CRAN (R 4.2.0)
##  DBI             1.1.3      2022-06-18 [2] CRAN (R 4.2.0)
##  dbplyr          2.2.1      2022-06-27 [2] CRAN (R 4.2.0)
##  digest          0.6.29     2021-12-01 [2] CRAN (R 4.2.0)
##  dplyr         * 1.0.9      2022-04-28 [2] CRAN (R 4.2.0)
##  ellipsis        0.3.2      2021-04-29 [2] CRAN (R 4.2.0)
##  evaluate        0.16       2022-08-09 [1] CRAN (R 4.2.1)
##  fansi           1.0.3      2022-03-24 [2] CRAN (R 4.2.0)
##  farver          2.1.1      2022-07-06 [2] CRAN (R 4.2.0)
##  fastmap         1.1.0      2021-01-25 [2] CRAN (R 4.2.0)
##  forcats       * 0.5.1      2021-01-27 [2] CRAN (R 4.2.0)
##  fs              1.5.2      2021-12-08 [2] CRAN (R 4.2.0)
##  gargle          1.2.0      2021-07-02 [2] CRAN (R 4.2.0)
##  generics        0.1.3      2022-07-05 [2] CRAN (R 4.2.0)
##  ggmap         * 3.0.0      2019-02-05 [2] CRAN (R 4.2.0)
##  ggplot2       * 3.3.6      2022-05-03 [2] CRAN (R 4.2.0)
##  glue            1.6.2      2022-02-24 [2] CRAN (R 4.2.0)
##  googledrive     2.0.0      2021-07-08 [2] CRAN (R 4.2.0)
##  googlesheets4   1.0.0      2021-07-21 [2] CRAN (R 4.2.0)
##  gtable          0.3.0      2019-03-25 [2] CRAN (R 4.2.0)
##  haven           2.5.0      2022-04-15 [2] CRAN (R 4.2.0)
##  here          * 1.0.1      2020-12-13 [2] CRAN (R 4.2.0)
##  highr           0.9        2021-04-16 [2] CRAN (R 4.2.0)
##  hms             1.1.1      2021-09-26 [2] CRAN (R 4.2.0)
##  htmltools       0.5.3      2022-07-18 [2] CRAN (R 4.2.0)
##  httr            1.4.3      2022-05-04 [2] CRAN (R 4.2.0)
##  isoband         0.2.5      2021-07-13 [2] CRAN (R 4.2.0)
##  jpeg            0.1-9      2021-07-24 [2] CRAN (R 4.2.0)
##  jquerylib       0.1.4      2021-04-26 [2] CRAN (R 4.2.0)
##  jsonlite        1.8.0      2022-02-22 [2] CRAN (R 4.2.0)
##  knitr           1.40       2022-08-24 [1] CRAN (R 4.2.0)
##  labeling        0.4.2      2020-10-20 [2] CRAN (R 4.2.0)
##  lattice         0.20-45    2021-09-22 [2] CRAN (R 4.2.1)
##  lifecycle       1.0.2      2022-09-09 [1] CRAN (R 4.2.0)
##  lubridate       1.8.0      2021-10-07 [2] CRAN (R 4.2.0)
##  magrittr        2.0.3      2022-03-30 [2] CRAN (R 4.2.0)
##  MASS            7.3-58.1   2022-08-03 [2] CRAN (R 4.2.0)
##  mime            0.12       2021-09-28 [2] CRAN (R 4.2.0)
##  modelr          0.1.8      2020-05-19 [2] CRAN (R 4.2.0)
##  munsell         0.5.0      2018-06-12 [2] CRAN (R 4.2.0)
##  pillar          1.8.1      2022-08-19 [1] CRAN (R 4.2.0)
##  pkgconfig       2.0.3      2019-09-22 [2] CRAN (R 4.2.0)
##  plyr            1.8.7      2022-03-24 [2] CRAN (R 4.2.0)
##  png             0.1-7      2013-12-03 [2] CRAN (R 4.2.0)
##  purrr         * 0.3.4      2020-04-17 [2] CRAN (R 4.2.0)
##  R6              2.5.1      2021-08-19 [2] CRAN (R 4.2.0)
##  RColorBrewer  * 1.1-3      2022-04-03 [2] CRAN (R 4.2.0)
##  Rcpp            1.0.9      2022-07-08 [2] CRAN (R 4.2.0)
##  readr         * 2.1.2      2022-01-30 [2] CRAN (R 4.2.0)
##  readxl          1.4.0      2022-03-28 [2] CRAN (R 4.2.0)
##  reprex          2.0.1.9000 2022-08-10 [1] Github (tidyverse/reprex@6d3ad07)
##  RgoogleMaps     1.4.5.3    2020-02-12 [2] CRAN (R 4.2.0)
##  rjson           0.2.21     2022-01-09 [2] CRAN (R 4.2.0)
##  rlang           1.0.5      2022-08-31 [1] CRAN (R 4.2.0)
##  rmarkdown       2.14       2022-04-25 [2] CRAN (R 4.2.0)
##  rprojroot       2.0.3      2022-04-02 [2] CRAN (R 4.2.0)
##  RSocrata      * 1.7.11-2   2021-09-14 [2] CRAN (R 4.2.0)
##  rstudioapi      0.13       2020-11-12 [2] CRAN (R 4.2.0)
##  rvest           1.0.2      2021-10-16 [2] CRAN (R 4.2.0)
##  sass            0.4.2      2022-07-16 [2] CRAN (R 4.2.0)
##  scales          1.2.0      2022-04-13 [2] CRAN (R 4.2.0)
##  sessioninfo     1.2.2      2021-12-06 [2] CRAN (R 4.2.0)
##  sp              1.5-0      2022-06-05 [2] CRAN (R 4.2.0)
##  stringi         1.7.8      2022-07-11 [2] CRAN (R 4.2.0)
##  stringr       * 1.4.0      2019-02-10 [2] CRAN (R 4.2.0)
##  tibble        * 3.1.8      2022-07-22 [2] CRAN (R 4.2.0)
##  tidyr         * 1.2.0      2022-02-01 [2] CRAN (R 4.2.0)
##  tidyselect      1.1.2      2022-02-21 [2] CRAN (R 4.2.0)
##  tidyverse     * 1.3.2      2022-07-18 [2] CRAN (R 4.2.0)
##  tzdb            0.3.0      2022-03-28 [2] CRAN (R 4.2.0)
##  utf8            1.2.2      2021-07-24 [2] CRAN (R 4.2.0)
##  vctrs           0.4.1      2022-04-13 [2] CRAN (R 4.2.0)
##  vroom           1.5.7      2021-11-30 [2] CRAN (R 4.2.0)
##  withr           2.5.0      2022-03-03 [2] CRAN (R 4.2.0)
##  xfun            0.31       2022-05-10 [1] CRAN (R 4.2.0)
##  xml2            1.3.3      2021-11-30 [2] CRAN (R 4.2.0)
##  yaml            2.3.5      2022-02-21 [2] CRAN (R 4.2.0)
##
##  [1] /Users/soltoffbc/Library/R/arm64/4.2/library
##  [2] /Library/Frameworks/R.framework/Versions/4.2-arm64/Resources/library
##
## ──────────────────────────────────────────────────────────────────────────────