HW04: Programming in R
Overview
Due by 11:59pm on September 27th.
Accessing the hw04 repository
Go here and find your copy of the hw04 repository. It follows the naming convention hw04-<USERNAME>. Clone the repository to your computer.
Part 1: Programming exercises
Compute the number of unique values in each column of
penguinsfrom thepalmerpenguinspackage.- Write code that uses a
forloop to do this task. - Write code that uses one of the
mapfunctions to do this task. - Write code that uses the
across()function to do this task.
- Write code that uses a
Calculate the square of each element in vector
x:## [1] 30 29 28 27 26 25 24 23 22 21 20 19 18 17 16 15 14 13 12 11 10 9 8 7 6 ## [26] 5 4 3 2 1- Write code that uses a
forloop to do this task. - Write code that uses one of the
mapfunctions to do this task.
- Write code that uses a
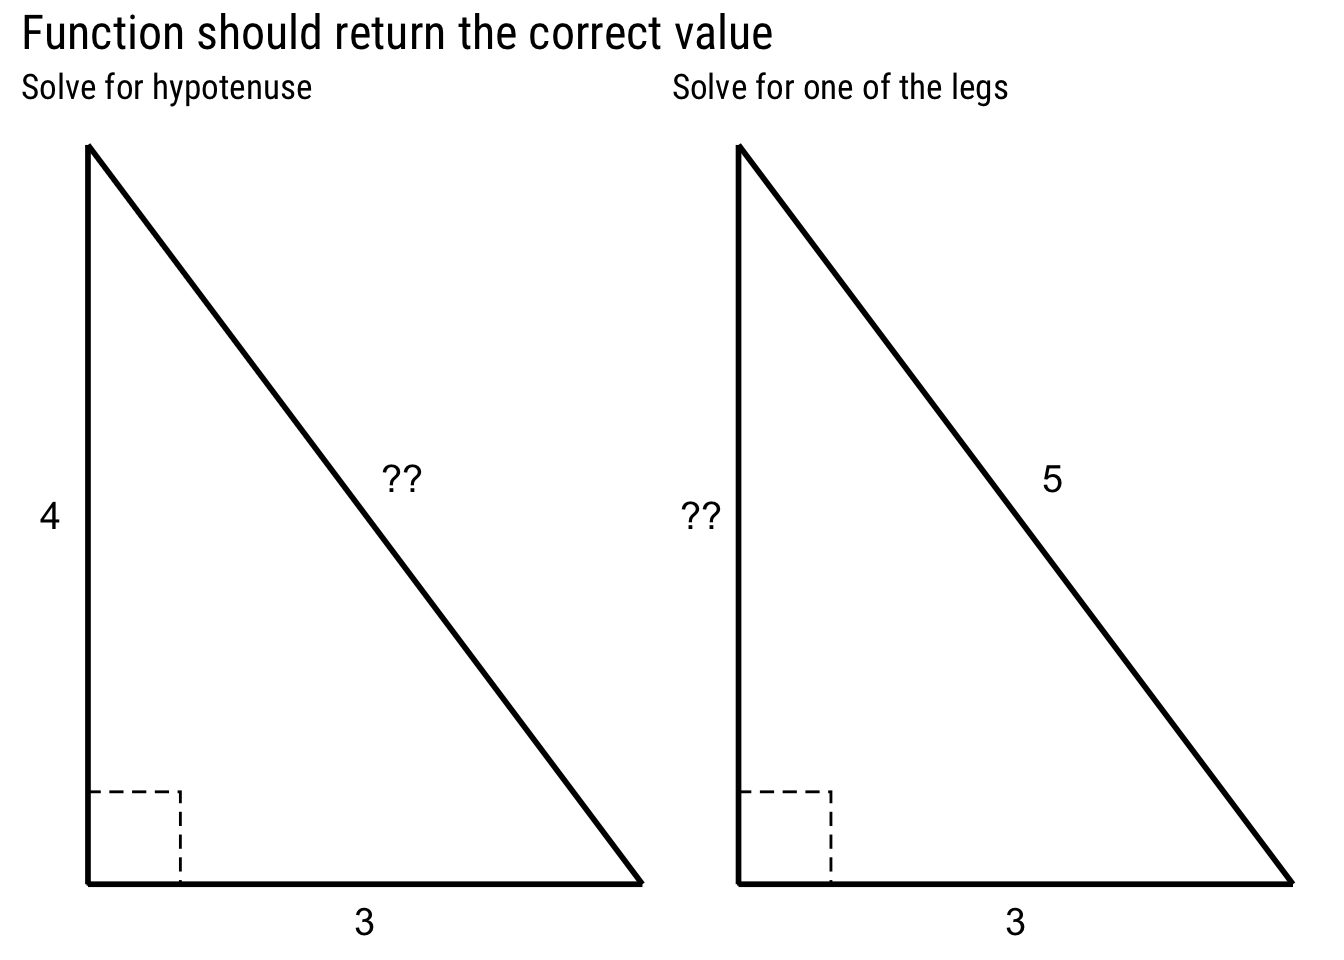
$$a^2 + b^2 = c^2$$
- Write a function that, given the lengths of two sides of the triangle, calculates the length of the third side
- This function should be flexible - that is, the function works if I give it values for $a$ and $b$, or $b$ and $c$, or $a$ and $c$
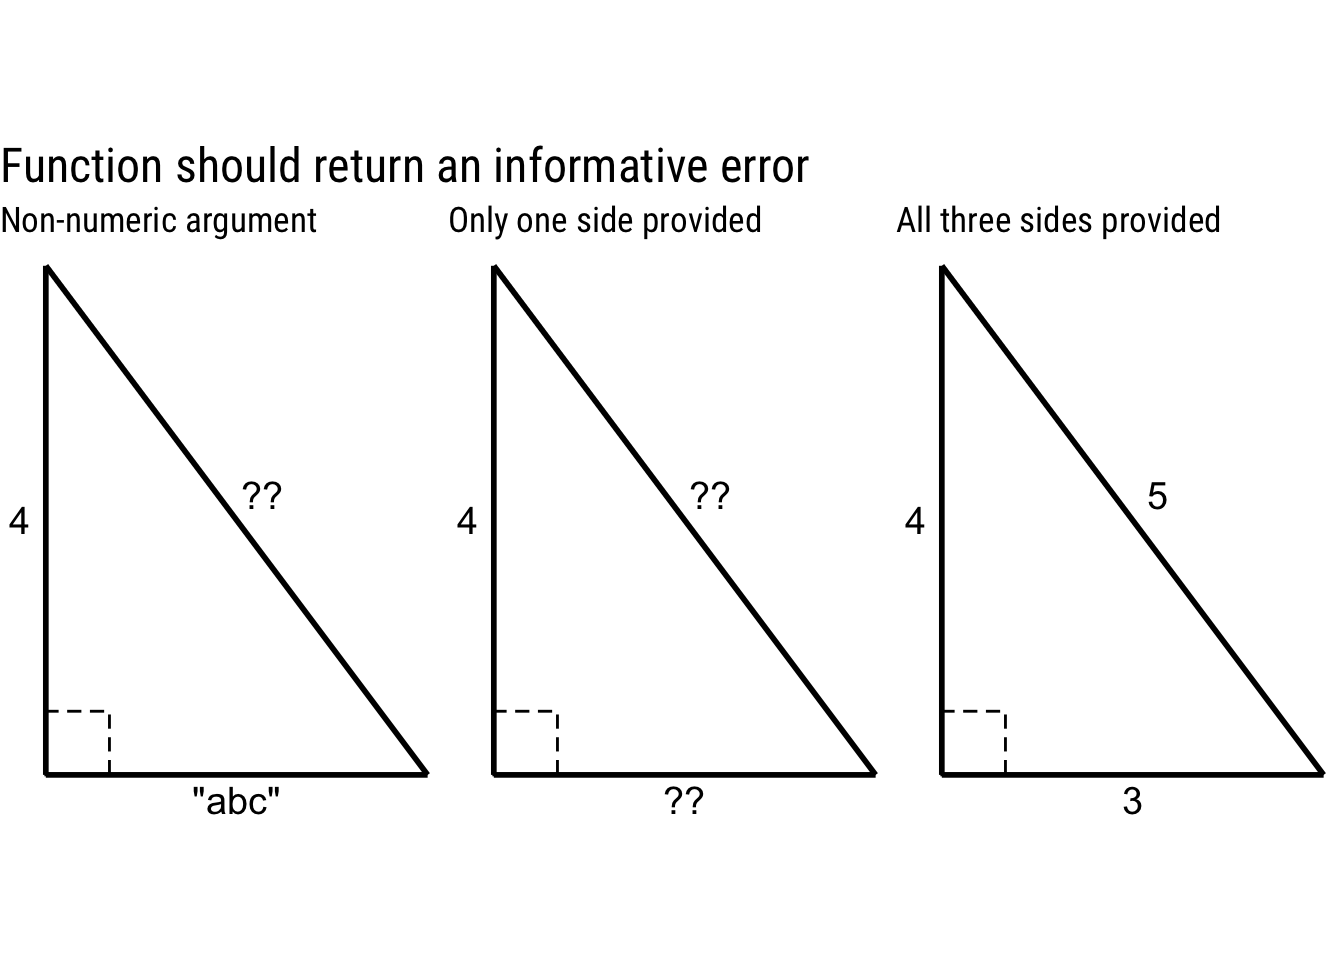
- If the user only provides the length of one side, the function should throw an error with
stop(). Likewise, if the user provides the lengths of all three sides, the function should throw an error. - If the user provides any values other than numeric values, the function should throw an error
- Your function should be able to correctly handle the examples below:
Part 2: Using programming in data analysis
The World Bank publishes extensive socioeconomic data on countries/economies around the world. In the data_world_bank folder, I have downloaded the World Bank’s complete economic indicators for each country in their database.
In order to analyze the data, you first need to import it. Each economy’s data is stored in a separate .csv file.
You should write a function which imports a single data file. The function should use one argument (the filepath to the data file). Given this path, the function should read and tidy the economy data, and return the cleaned data frame as the output. Remember the rules for a tidy data frame:
- Each variable must have its own column.
- Each observation must have its own row.
- Each value must have its own cell.
Since the World Bank has hundreds of indicators, your function should pare this down to only the handful of variables you intend to analyze.
Once you have written this function, demonstrate that it works by importing the data files and combining them into a single data frame using an iterative operation.
Let’s recap the requirements for your function
- Give it a meaningful name
- It should take a single argument - the filepath to the data file. Chapter 8 of R for Data Science explains directory structures and how to access files in a project. Review this. You will be marked down if your function requires an absolute file path such as
/Users/soltoffbc/Projects/Computing for Information Science/homework/hw04 - Do not try and run the iterative operation inside of the function. Technically this can work, but it is far harder to fix errors and write the body of the function if you are performing both tasks simultaneously.
- The output of the function should be a tidy data frame for a single country, pared down to 2-4 substantive variables you will analyze.
Once you have the data imported, write a brief report exploring and analyzing at least two variables in the data. Use a combination of descriptive statistics, tables, and figures, and present your results and analysis in a coherent and interpretable manner. The main point is that your report should not just be code and output from R - you also need to include your own written analysis. Submitting the report as an Quarto document will make this much easier (and is in fact mandatory).
Submit the assignment
Your assignment should be submitted as two Quarto documents using the gfm (GitHub Flavored Markdown) format. Follow instructions on homework workflow.
Rubric
Needs improvement: Displays minimal effort. Doesn’t complete all components. Code is poorly written and not documented. World Bank analysis is slapped together, or just contains code and output. No history of commits to document work.
Satisfactory: Solid effort. Hits all the elements. No clear mistakes. Easy to follow (both the code and the output). Nothing spectacular, either bad or good.
Excellent: Functions are written succinctly and comprehensibly. Error checks are incorporated into functions as appropriate. Code is written parsimoniously and properly formatted. Frequent use of commits to track changes. Exploratory analysis demonstrates thought and consideration of the relationships. Graphs and tables are properly labeled. Descriptive text is incorporated into the World Bank analysis that explains what you are examining and how to interpret the results.