HW07: Machine learning
Overview
Due by 11:59pm on November 1st.
Accessing the hw07 repository
Go here and find your copy of the hw07 repository. It follows the naming convention hw07-<USERNAME>. Clone the repository to your computer.
Part 1: Student debt
Median student debt in the United States has increased substantially over the past twenty years.
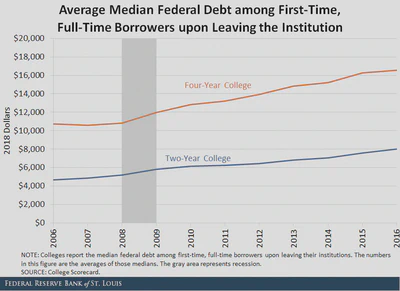
rcis::scorecard includes debt, which reports the median debt of students after leaving school in 2019.
unitid and name as predictors. These serve as id variables in the data set and uniquely identify each observation. They are not useful in predicting an outcome of interest.- Split
scorecardinto training and test sets with 75% allocated to training and 25% allocated to testing. - Split the training set into 10 distinct folds for cross-validation.
- Estimate a linear regression model to predict
debtas a function of all the other variables in the dataset except forstate, using 10-fold cross-validation. Report the RMSE for the model.1 - Estimate a decision tree model to predict
debtusing 10-fold cross-validation. Use therpartengine. Report the RMSE for the model.
For those looking to stretch themselves
Estimate one or more models which utilize some aspect of feature engineering or model tuning. Discuss the process you used to estimate the model and report on its performance.
Part 2: Predicting attitudes towards marijuana legalization
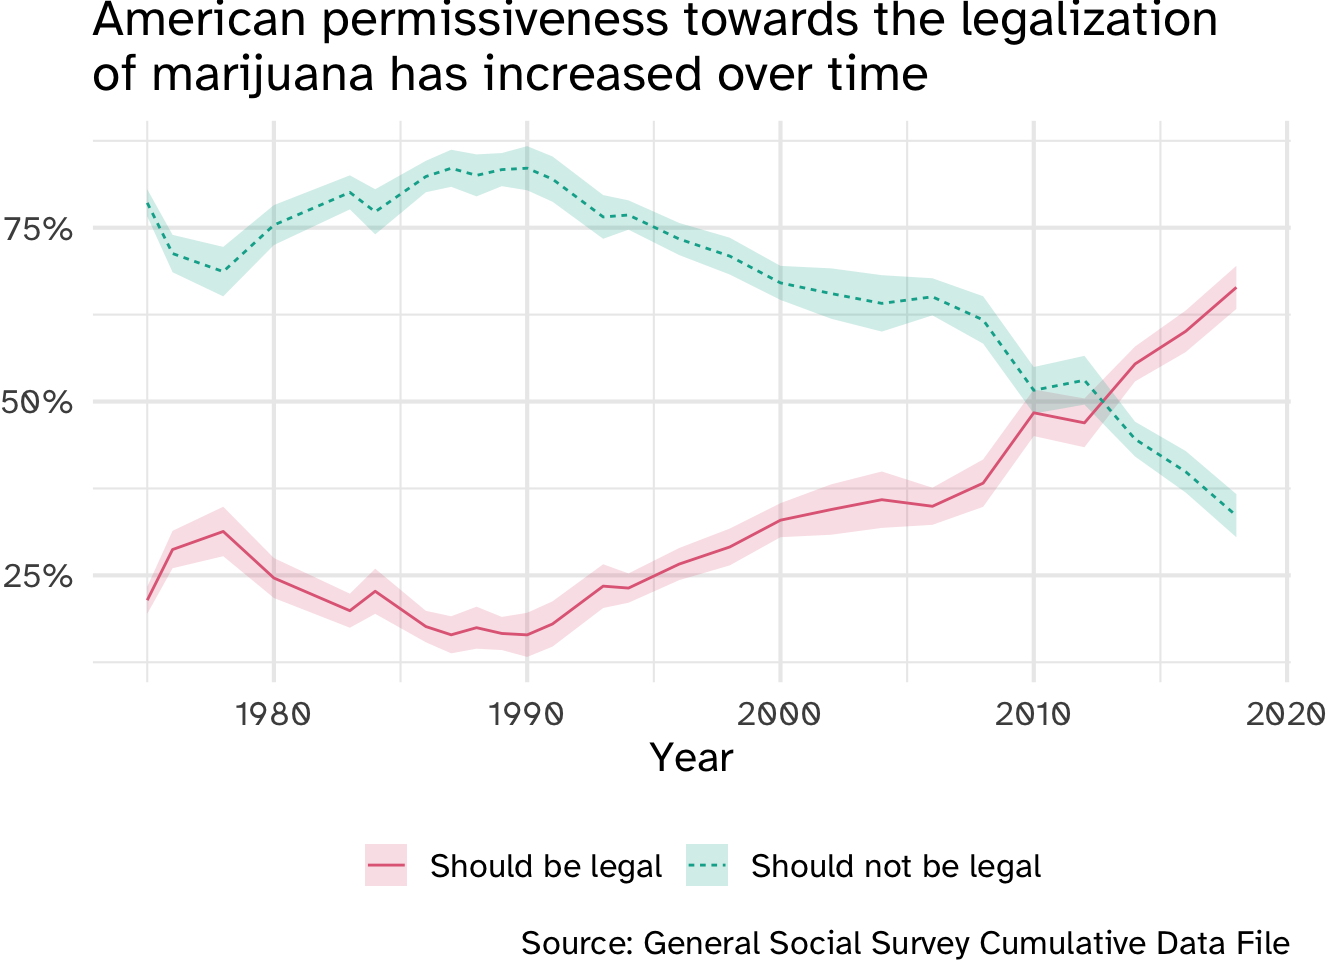
The General Social Survey is a biannual survey of the American public.
Over the past twenty years, American attitudes towards marijuana have softened extensively. In the early 2010s, the number of Americans who believed marijuana should be legal began to outnumber those who thought it should not be legal.
rcis::gss contains a selection of variables from the 2018 GSS. The outcome of interest grass is a factor variable coded as either "legal" (respondent believes marijuana should be legal) or "not legal" (respondent believes marijuana should not be legal).
Make sure you have the most recent version of rcis. If the version is less than 0.2.6, reinstall rcis using the most recent version.
if (packageVersion("rcis") < 0.2.6) {
  remotes::install_github("cis-ds/rcis")
}
id and wtss as predictors. These serve as id variables in the data set and uniquely identify each observation. They are not useful in predicting an outcome of interest.Split
gssinto training and test sets with 75% allocated to training and 25% allocated to testing.Estimate a logistic regression model to predict
grassas a function ofage,degree,happy,partyid, andsex,. Implement 10-fold cross-validation. Report the accuracy of the model.Estimate a random forest model to predict
grassas a function of all the other variables in the dataset (exceptidandwtss). In order to do this, you need to impute missing values for all the predictor columns. This means replacing missing values (NA) with plausible values given what we know about the other observations.- Remove rows with an
NAforgrass- we want to omit observations with missing values for outcomes, not impute them - Use median imputation for numeric predictors
- Use modal imputation for nominal predictors
Implement 10-fold cross-validation. Report the accuracy of the model.
- Remove rows with an
Estimate a $5$-nearest neighbors model to predict
grass. Userecipesto prepare the data set for training this model (e.g. scaling and normalizing variables, ensuring all predictors are numeric). Be sure to also perform the same preprocessing as for the random forest model. Make sure your step order is correct for the recipe. Implement 10-fold cross-validation. Report the accuracy of the model.Estimate a ridge logistic regression model to predict
grass.2 Use the same recipe as for the $5$-nearest neighbors model. Implement 10-fold cross-validation, and utilize the same recipe as for the $k$-nearest neighbors model. Report the accuracy of the model.Revisit the random forest model used previously. This time, implement hyperparameter tuning over the
mtryandmin_nto find the optimal settings. Use at least ten combinations of hyperparameter values. Report the best five combinations of values.Select the best performing model. Train that recipe/model using the full training set and report the accuracy/ROC AUC using the held-out test set of data. Visualize the ROC curve.
?gss to open a documentation file in R.Submit the assignment
Your assignment should be submitted as a set of two Quarto documents using the gfm (GitHub Flavored Markdown) format. Follow instructions on homework workflow.
Rubric
Needs improvement: Cannot get code to run or is poorly documented. No documentation in the README file. Severe misinterpretations of the results. Overall a shoddy or incomplete assignment.
Satisfactory: Solid effort. Hits all the elements. No clear mistakes. Easy to follow (both the code and the output). Nothing spectacular, either bad or good.
Excellent: Interpretation is clear and in-depth. Accurately interprets the results, with appropriate caveats for what the technique can and cannot do. Code is reproducible. Writes a user-friendly README file. Implements appropriate visualization techniques for the statistical model. Results are presented in a clear and intuitive manner.
View the documentation for
yardstickto find the appropriate function for RMSE. ↩︎logistic_reg(penalty = .01, mixture = 0)↩︎